Use PingPlotter to Diagnose Network Issues

Written by Marissa Orsini
Updated at November 7th, 2024
Table of Contents
Scope:
This document will show you how to run a ping towards our SIP servers and export the data. This application is used to see if there latency or packet loss within the network or ISP. Data can explain why you may be experiencing call quality issues.
Requirements:
- Install PingPlotter (Has a 14 day free trial)
- Workstation/Server on the same local network as endpoints.
Install PingPlotter
- Download PingPlotter here
- Install and select the option for the 14 day trial.
Configuring PingPlotter
- Set Enter target name or IP to one of our servers (see IP Addresses and Ports)

- Press the Play button and let it run for 4 hours during work hours.
Exporting Data
- Click Pause icon.
- Click File.
- Click Export Sample Set.

- Save it on your computer.
- Email it to support for troubleshooting.
Interpreting PingPlotter Results
Understanding PingPlotter graphs begins with the final destination — that's the target you're testing. PingPlotter represents the final destination with the bottom row of the trace graph.
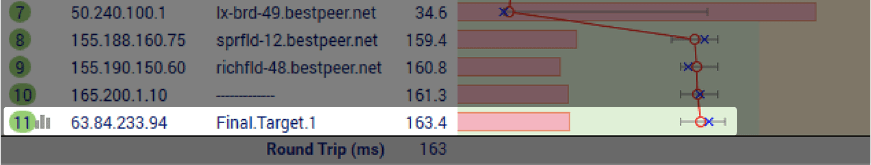
Check for packet loss.
Take a look at your PingPlotter results. Do you see a red bar? If so, that means some data was lost between your computer and the target. This effect is known as packet loss, and if you're seeing it on the final destination, there's a good chance you captured a problem.
Check for latency.
What about the black line? It shows how long it takes data to travel to your target and back. This measurement is known as latency. It's another network problem indicator. The further to the right the black line is the longer it takes for data to travel around the network. If you see high latency on your final destination, you've probably captured a network problem.
Follow the pattern to the source.
When you have an idea of what's happening at the final destination, it's time to look at the rows leading up to the final destination. Do you notice any patterns leading up to the final destination?
Where the pattern begins, helps you understand the source of the problem. If the pattern starts on the first row in the graph (your router), you're probably dealing with a local network problem.
If the pattern originates somewhere in between the first and last row, the problem is probably outside your local network.